Giraffe Feature Spotlight: Map, Pencil, Calculator, and a Live Presentation Layer
This was the second TRXL Feature Spotlight. No slides, no pitch deck — just Rob Asher sharing his screen and walking me through Giraffe, the platform he built for architects, designers, and real estate developers. We covered two things: Core, which is the foundation of everything Giraffe does, and Paper, a presentation app Rob built on Giraffe's own app store.
Watch the Replay
My Takeaways
I've been watching Giraffe for a while. Rob has been on the podcast before. I wanted to see it live, in real time, with actual geometry on an actual site.
Here's what we covered.
Core: The Map
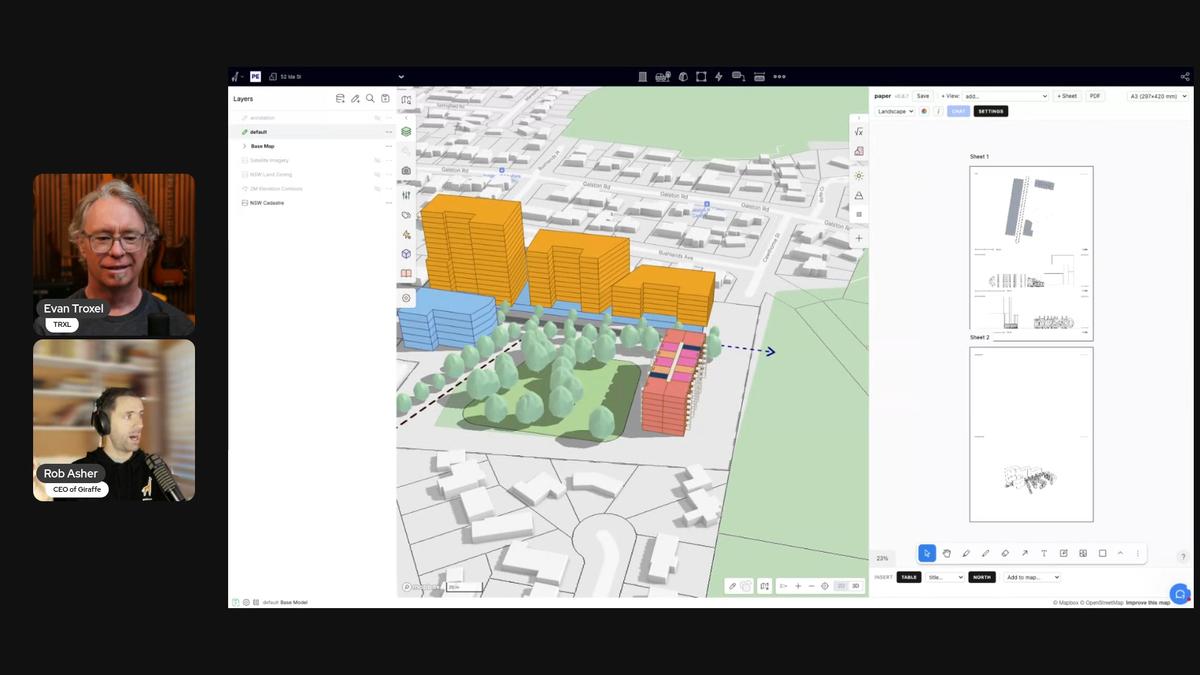
The first thing to understand about Giraffe is that it's map-first. Not model-first.
Most architectural software starts with a blank document. You open a file, draw something, and then spend hours pulling in site context — adjacent building models, GIS data, zoning layers, parcel boundaries — through workflows that produce data that's dumb once it gets in. Rob and I spent years doing exactly this in Rhino and Grasshopper. Getting the map into the model was a whole project.
Giraffe inverts this. You put your design information into the map. You're never operating on a little square. You're always on the whole planet.
The data layer system pulls directly from ESRI map servers and GIS infrastructure around the world. Rob demonstrated adding New South Wales land zoning and parcel data, but the system works anywhere with a government-hosted geo server. Right-clicking any geometry queries the database for its metadata: zoning classification, road type, when the record was created, whatever the source provides. It's rich data, connected and current, not imported once and frozen.
Rob made the point that most people involved in a project (except architects) think map-first. Assessors think map-first. Clients think map-first. Architects are unusual in that we think model-first. Giraffe is designed to close that gap.
Core: The Pencil and Calculator
Once you have the site, you draw on it.
The pencil borrows from Rhino and SketchUp. Shortcuts are built in: Shift D for dimension strings, Shift G for push-pull. Layers work the way you'd expect — folders, locking, transparency, active layer designation. Arrow and annotation types let you communicate design intent, not just geometry.
Watching Rob sketch a master plan layout over a live site brought back something I've felt in every early-stage project: the most useful thing you can do in a client meeting is draw. Not just because it's fast, but because drawing in front of someone produces information. "There's a stinky drain down there." "There's a telephone easement that's not on any plan." The sketch is an information vacuum. Giraffe makes that sketch live, on the map, with geometry that carries meaning.
The calculator is where it gets interesting. Before designing anything, you set up assumptions: efficiency ratios, rent, construction time, dwelling sizes, floor-to-floor heights, facade costs. Rob described this as getting the client to write down the numbers they already have in their heads. Then you assign a usage to a geometry object — residential, retail, whatever — and Giraffe starts calculating. Dwellings, paved area, facade area, open space: all live, all connected to the geometry.
The analytics layer takes it further. You can build custom formulas that pull from the model: hard cost = area from model times cost rate from assumptions. If you want to see what doubling the cost does, type *2. It's a pivot table that lives inside the design environment, connected to the geometry driving it.
Everything runs on the platform. Nothing lives on anyone's C drive. Rob demoed a project for over 25 minutes and at no point was he exporting, sharing files, or managing links. That's the point.
Paper: A Presentation Layer Built Inside Giraffe
The second feature was Paper, and this one has a different backstory.
Paper is not part of Giraffe's core code. Rob built it himself as a Giraffe app — roughly 40 hours of development working with Claude, now at version 0.8.7 with around 100 versions in. It runs on Giraffe's app store, which supports third-party and firm-built applications alongside the platform's own tools.
Paper is an infinite canvas. You add frames to it. Each frame is a live viewport of the Giraffe model: a plan, an axonometric, or an elevation. Same concept as Paper Space in AutoCAD or layouts in Rhino — double-click into a frame and you're navigating the model. Controls for cut height, line widths, layer visibility, and color overrides are all there. Elevations auto-populate with relative levels based on every unique level in the project.
The AI integration uses a BYO API key. You bring your own Gemini or Claude token. Organizations can deploy a token centrally and monitor usage. Rob showed preset prompts rendered against the model image: collage style, pen and ink, watercolor, perspective. Freehand sketch overlays you draw on the canvas are part of the prompt to maintain the diagrammatic quality, or you can add a custom prompt to direct it further.
The feature that surprised me most was the area table. You type a plain-language request: "Summarize gross and net areas by usage in a table." Giraffe calls the API, which writes code that queries the model and returns the table alongside the formula that built it. You can read the formula and verify it isn't making things up, then insert the table directly into your Paper canvas.
The pitch: go from site context to massing to feasibility to a client-ready presentation without leaving the platform. When Rob had a north arrow, plans cut at two levels, AI-styled imagery, and an area table all on one canvas, I thought about how long that same output would take in the usual pipeline. View capture, file management, link management, re-export every time something changes. In Giraffe, it's just live.
Bonus features: Squeeze and Building Skin
We had a few extra minutes, so Rob showed Squeeze — another app he wrote with about 30 hours of development. Rob was (and still is) a Grasshopper wizard, so your mileage may vary. The point is that this kind of thing is included in the platform so you don't have to reinvent the wheel from scratch.
Most apartment layout algorithms pack rectangles along a corridor. Australian residential tends toward more sculptural floor plates, so Rob built the inverse: give it an irregular polygon, and it squeezes apartments into it. Once the layout bakes to a layer, a separate app called Building Skin applies a facade system to the output.
Two knowledge modules, sequenced together. The apartment layout logic is one app. The facade system is another. Neither needs to know what the other is doing. Giraffe sits between them as the lightweight interface.
Rob said it well: the human does the gesture, the algorithm does the predictable technical work downstream. That's the right abstraction level. The lighter the driver geometry, the faster every design change moves. The moment a model gets too heavy, change is painful. Giraffe is built around that constraint from the start.
Practical Notes
- Pricing: Core platform is $45/month. Teams/enterprise is around $1,500 USD per user per year.
- Learning curve: Rob estimated a few hours to get comfortable with the core concepts. Familiarity with SketchUp and InDesign helps.
- AI approach: BYO API key (Gemini or Claude). No proprietary model. Organization-level token deployment available.
- Open platform: No proprietary data format. Connect your own GIS server. Open to external fine-tuned AI models.
- Collaboration: Platform-based. Projects live in Giraffe and are shareable from day one. Nothing local.
Where to See It
Head to giraffe.build to explore the platform and sign up.
Thanks to Rob Asher for a genuinely useful demo. This is exactly what the Feature Spotlight format is built for.
Comments ()