

Introducing Field Reports
A new home for TRXL interactive episode infographics — one page per episode, every visual breakdown, live for TRXL+ members.
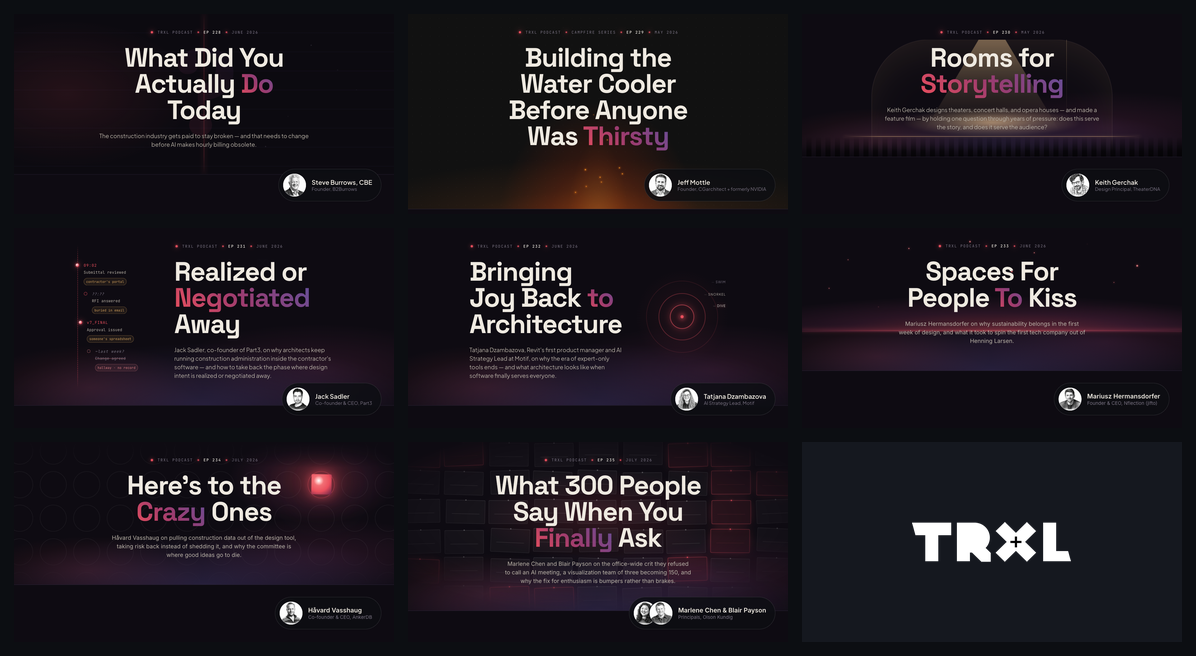
I've been building interactive infographics alongside recent TRXL episodes for a while now. Iterating. Testing. I'm finally at a point where I think they are good enough to put in front of my supporting members.
What are Field Reports? Each one takes an episode and its newsletter and turns it into something visual: diagrams, pull quotes, charts, the shape of the conversation laid out so you can see it, not just read it. Closer to a magazine spread than another wall of text in your inbox.




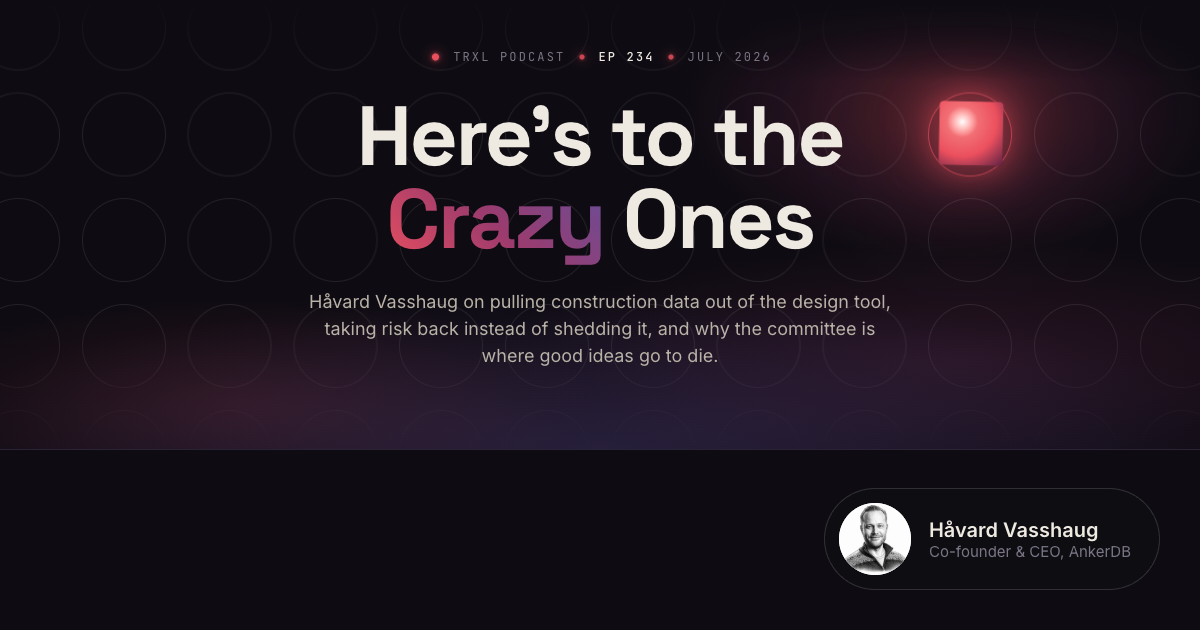

Field Reports is live at trxl.co/field-reports. Click through and you get the full interactive version of a TRXL conversation: pull quotes, structural breakdowns, key insights, the stuff that never fits in a headline.
Eight are up right now, episodes 228 through 235, and every new one lands there automatically going forward.
It's a TRXL+ perk. If you're already a member, go take a look.
Not a TRXL+ member yet? Field Reports is just one of the things a membership pays for. Join and get access, plus the ad-free podcast feed and the full newsletter for every episode.